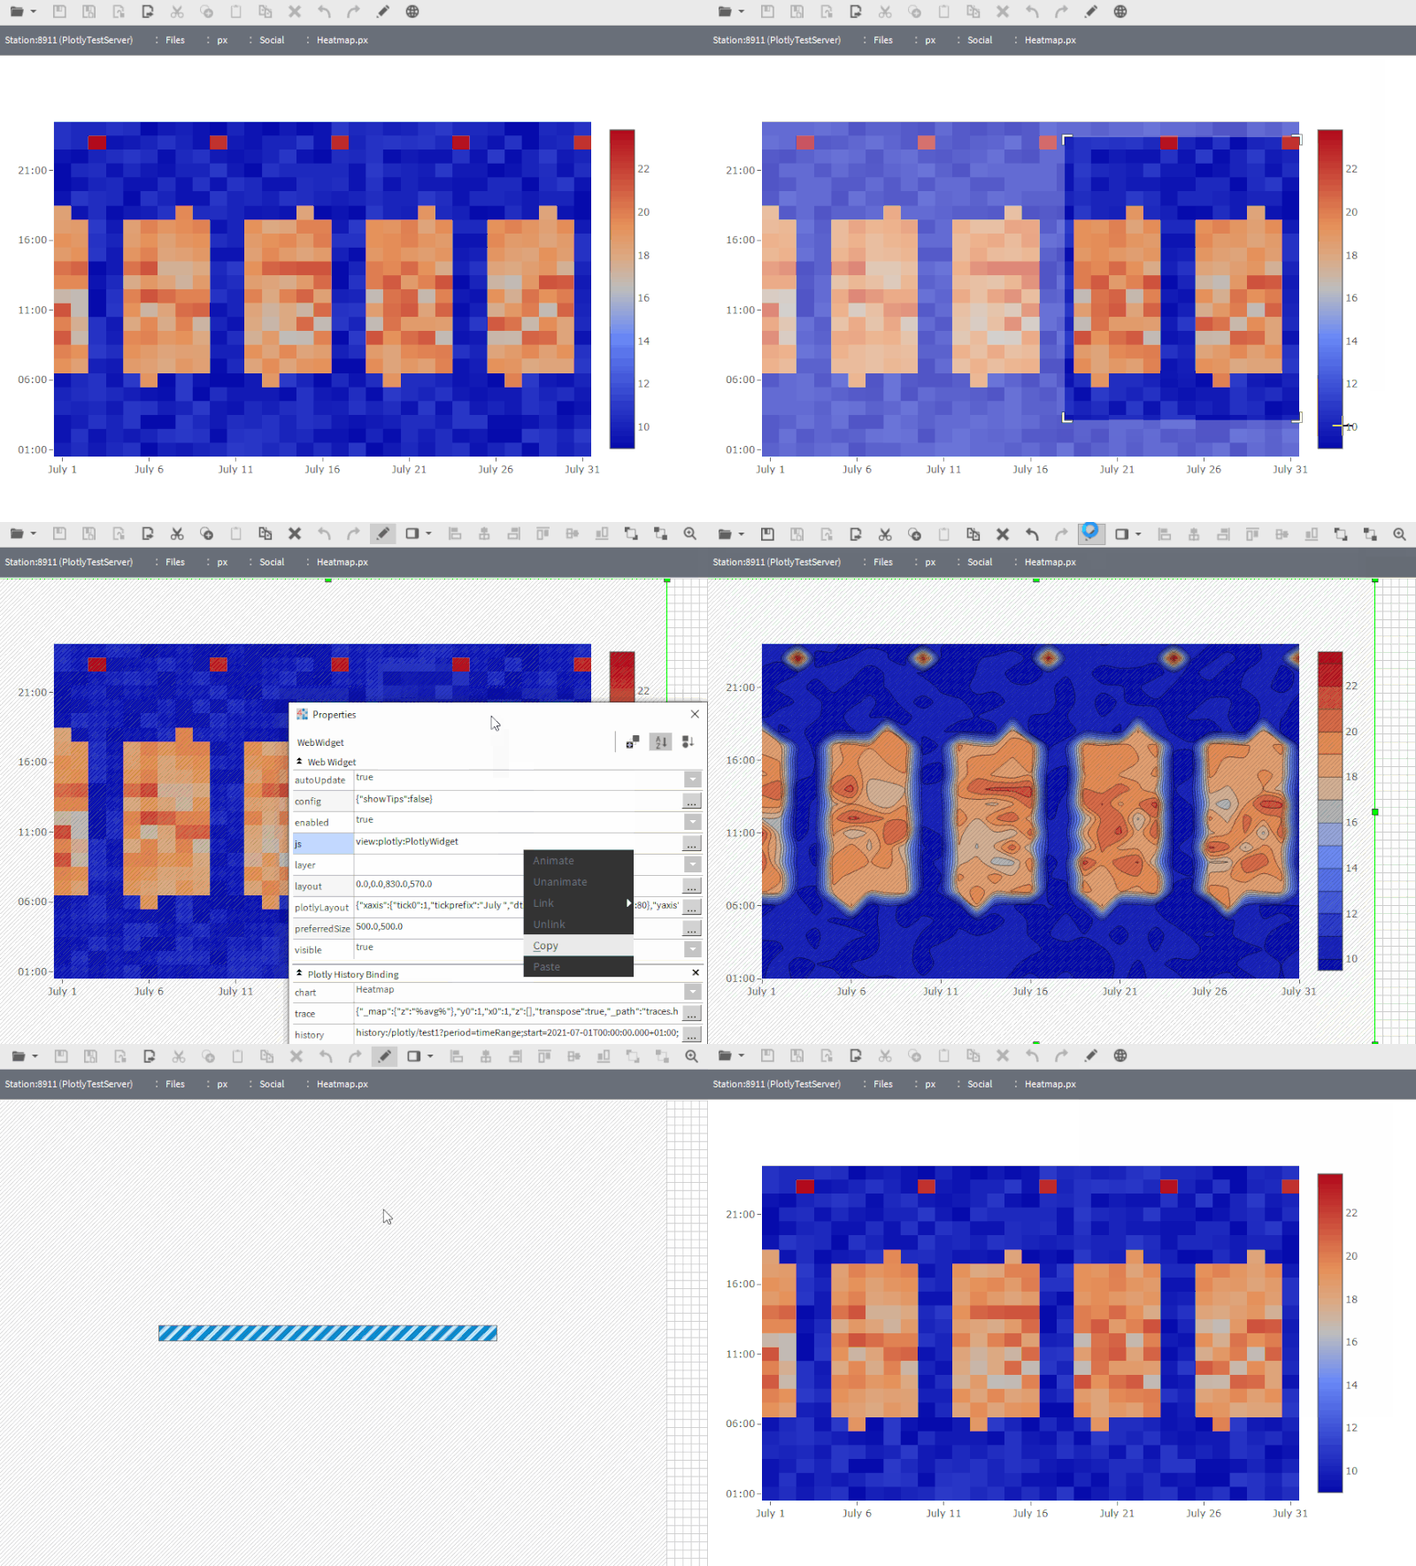
Heatmap widget
A heatmap is a powerful two-dimensional visualization tool that represents individual values within a matrix using color gradients. By mapping data intensity to colors, it provides an intuitive way to identify patterns, correlations, and anomalies within large datasets. This technique is particularly useful for analyzing trends over time, comparing performance metrics, or detecting irregularities in system behavior.
In applications such as building management, heatmaps can highlight variations in energy consumption, equipment efficiency, or temperature distribution across different zones. By leveraging real-time or historical data, users can quickly pinpoint areas of concern, optimize resource allocation, and make informed decisions. The ability to adjust color scales and thresholds enhances interpretability, making heatmaps a valuable asset for data-driven analysis and monitoring.
N4.8+
The widget is included in the Data Analytics and Visualization library, and purchasing it provides access to all widgets in the library. Two types of licenses are available: one for JACE and another for Supervisor. There are no restrictions on the number of widgets or bindings you can use.
The widget is part of the Data Analytics and Visualization library, and its purchase grants access to all widgets within the library.
| Versions | Price |
|---|---|
| Heatmap widget-JACE | $598.00 |
| Heatmap widget-Supervisor | $1,555.00 |
Question: Which charts will I get after the purchase?
Answer: The widget is part of the Data Analytics and Visualization library, and its purchase grants access to all 40 widgets within the library.
Question: Does this widget support real-time data, historical data, or both?
Answer: The widget is designed to support real-time data, such as Numeric Points. While it is technically possible to use historical data, this is not recommended due to the nature of the widget.
Question: Is it possible to customize various aspects of the widget, such as its size, shapes, colors, and fonts?
Answer: All visual elements are fully configurable in the Niagara PX Editor, with context help available for every configuration attribute.
Please email us to support@baudrate.io if you have any questions
Explore all Heatmap widget images and videos
View Gallery© 2024 Tridium Inc. All rights reserved.
Tridium, Inc., is a wholly owned subsidiary of Honeywell International Inc.


