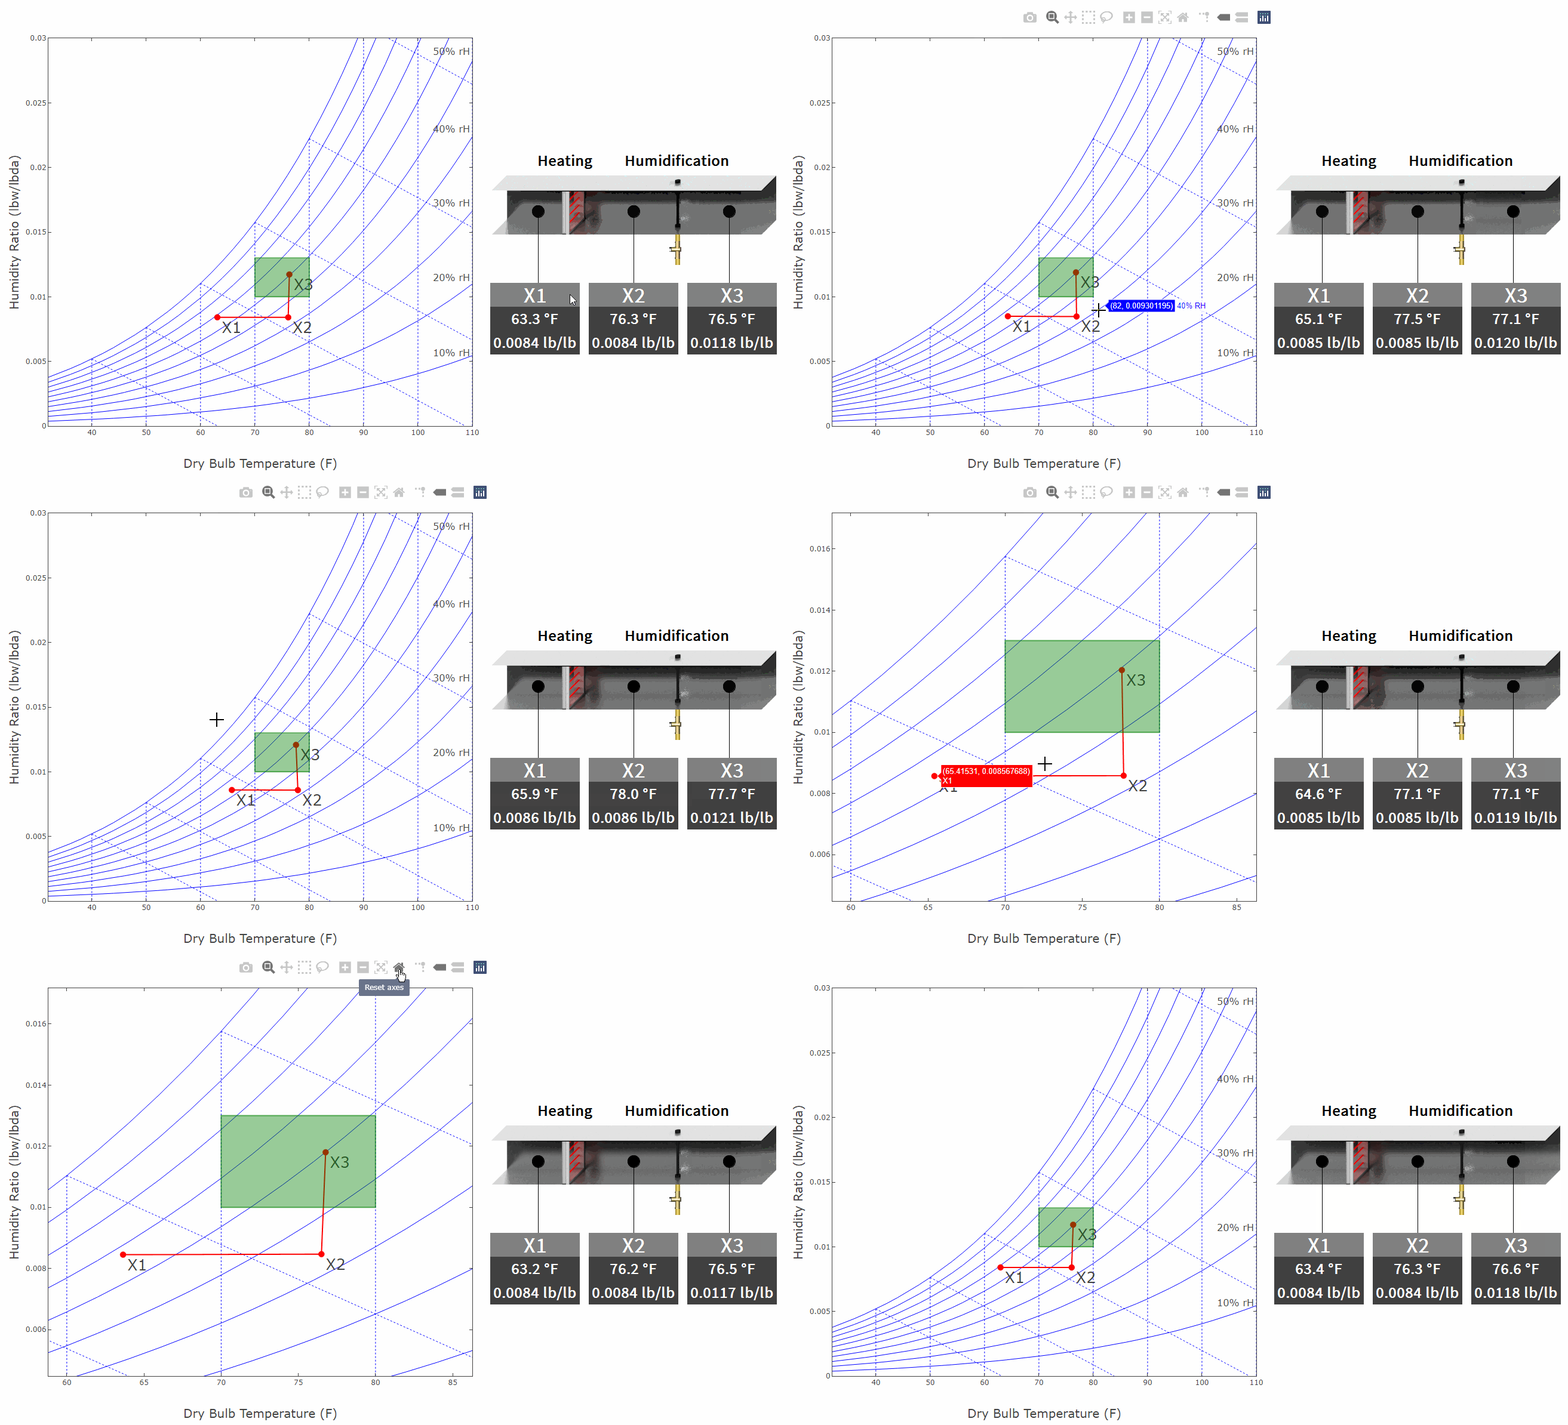
Psychrometric Chart Widget
- Psychrometric ChartA psychrometric chart visually represents the relationship between air temperature, humidity, and other thermodynamic properties within an air handling unit. This chart helps analyze moisture content, enthalpy, and dew point, providing insights into HVAC performance and air conditioning efficiency.
Psychrometric chart provides a graphic relationship of the state or condition of the air at any particular time. It displays the properties of air: dry bulb temperature, wet bulb temperature, dew point temperature, and relative humidity. Given any two of these properties, the other two can be determined using the chart.
The chart’s usefulness lies beyond the mere representation of these elementary properties – it also describes the air’s moisture content, energy content, specific volume, and more. The psychrometric chart conveys an amazing amount of information about air. It provides an invaluable aid in illustrating and diagnosing environmental problems such as why heated air can hold more moisture, and conversely, how allowing moist air to cool will result in condensation.
A psychrometric chart also helps in calculating and analyzing the work and energy transfer of various air-conditioning processes. In practical applications, the most common psychrometric analysis made by HVAC contractors involves measuring the dry and wet bulb temperatures of air entering and leaving a cooling coil. If these temperatures are known along with the volumetric air flow rate through the coil, the cooling capacity of a unit can be verified. Using the dry and wet bulb temperature information, two points can be located on a psych chart and the corresponding enthalpy values read for them. The total BTUH cooling capacity can then be determined. Contractors often have to perform this calculation to prove that their equipment is working satisfactorily.
Key features
- animated changes of temperature and humidity
- interactive controls: zoom and pan
- draw unlimited number of charts per host
- any color scheme
- almost every chart aspect can be customized
- automatic reporting and pdf generation
- deploy on Supervisor or JACE
N4.8+
The widget is included in the Data Analytics and Visualization library, and purchasing it provides access to all widgets in the library. Two types of licenses are available: one for JACE and another for Supervisor. There are no restrictions on the number of widgets or bindings you can use.
The widget is part of the Data Analytics and Visualization library, and its purchase grants access to all widgets within the library.
| Versions | Price |
|---|---|
| Psychrometric Chart Widget-JACE | $598.00 |
| Psychrometric Chart Widget-Supervisor | $1,555.00 |
Question: Which charts will I get after the purchase?
Answer: The widget is part of the Data Analytics and Visualization library, and its purchase grants access to all 40 widgets within the library.
Question: Do you provide a free trial version?
Answer: Yes, please message us or send an email to support@baudrate.io. Make sure to include your Niagara Host ID so we can generate a trial license for you promptly.
Question: Is it possible to customize various aspects of the widget, such as its size, shapes, colors, and fonts?
Answer: All visual elements are fully configurable in the Niagara PX Editor, with context help available for every configuration attribute.
Please email us to support@baudrate.io if you have any questions
Explore all Psychrometric Chart Widget images and videos
View Gallery© 2024 Tridium Inc. All rights reserved.
Tridium, Inc., is a wholly owned subsidiary of Honeywell International Inc.

