

Sunburst widget
-
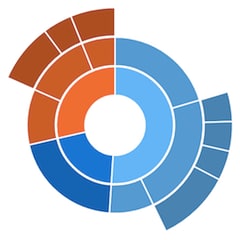
 Sunburst ChartSunburst example for energy consumption showing various types of energy consumed in a building, split between various types of equipment. A user can click on a sector to expand or collaple them dynamically.
The Sunburst widget is a powerful visualization tool for hierarchical data, displaying relationships in a radial layout that intuitively represents nested structures. It is particularly useful for analyzing energy consumption, equipment efficiency, and operational metrics across different levels, such as building floors, equipment types, or system components. Each segment represents a portion of the total value, with inner rings depicting higher-level categories and outer rings showing detailed subdivisions.
Its interactive nature allows users to drill down into specific layers, compare real-time or historical values, and gain insights into performance trends. For example, facility managers can analyze energy usage per floor, per equipment type, or even down to individual units, while also tracking operational factors such as run hours of chillers and compressors. By dynamically updating based on live data, the Sunburst widget enhances decision-making, helping users optimize efficiency, identify anomalies, and streamline resource allocation.
The widget is part of the Data Analytics and Visualization library, and its purchase grants access to all widgets within the library.
| Versions | Price |
|---|---|
| Sunburst widget-JACE | $598.00 |
| Sunburst widget-Supervisor | $1,555.00 |
Question: Do you provide a free trial version?
Answer: Yes, please message us or send an email to support@baudrate.io. Make sure to include your Niagara Host ID so we can generate a trial license for you promptly.
Question: Does this widget support real-time data, historical data, or both?
Answer: The widget is designed to support real-time data, such as Numeric Points. While it is technically possible to use historical data, this is not recommended due to the nature of the widget.
Question: Is it possible to customize various aspects of the widget, such as its size, shapes, colors, and fonts?
Answer: All visual elements are fully configurable in the Niagara PX Editor, with context help available for every configuration attribute.
Please email us to support@baudrate.io if you have any questions
Explore all Sunburst widget images and videos
View Gallery© 2024 Tridium Inc. All rights reserved.
Tridium, Inc., is a wholly owned subsidiary of Honeywell International Inc.
